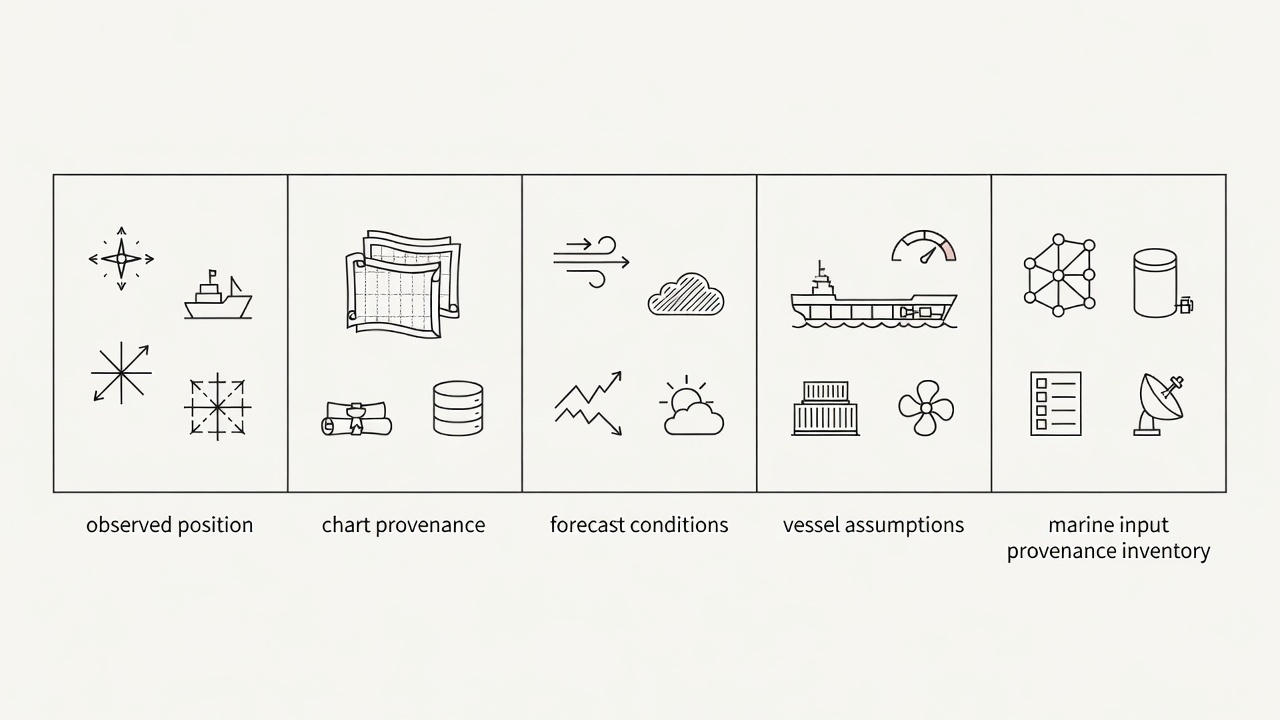
Marine decision support brings unlike information into one apparent picture: position fixes, electronic charts, traffic reports, forecasts and vessel performance estimates. Their proximity on a display does not make them equally current, accurate or complete. The first useful question is not “How intelligent is the route?” but “What evidence was available when it was produced?”
Separate the observation from the interpretation
A GNSS receiver provides an estimated position and associated status information. A route engine may then match that position to a track, calculate progress and infer a future arrival. Those are additional processing steps, not fresh observations. If the position is degraded, spoofed or incorrectly referenced, several apparently independent outputs can inherit the same underlying error.
Source diversity matters, but only when the sources are genuinely independent. Two applications receiving the same sensor feed do not provide two independent confirmations. Radar observations, visual bearings and other appropriate checks can contribute different evidence. The bridge team still needs to understand the instruments, applicable procedures and limitations of each comparison.
Read geography with its provenance attached
Electronic navigational charts are structured hydrographic products, not perfectly observed copies of the seabed. Survey age, coverage, source quality and update status matter. Display scale and selected layers also influence what a reader sees. The International Hydrographic Organization’s S-57 and S-100 frameworks describe data structures and standards; citing a framework alone does not establish the quality of every dataset used by an application.
Charted depths are not the same as an assured clearance beneath a moving ship. Draft, water level, squat, vessel motion and the uncertainty of the underlying information all matter. A planning model that omits one of these factors may still produce an attractive route. The omission should remain visible rather than disappearing inside an unexplained “safe” label.
Treat forecasts as time-dependent evidence
Weather and ocean forecasts carry an issue time, valid time, spatial resolution and modelling method. A recently downloaded file may contain an older forecast cycle. A grid cell can also conceal local effects near a headland or harbour entrance. Wind, waves and current products should not be treated as interchangeable merely because they share a colour scale.
Ensemble forecasts can help describe a range of plausible outcomes, but a range is not a guarantee that all relevant outcomes are represented. Near the English Channel or the approaches to Rotterdam, changing currents, traffic and local requirements can make timing consequential. These places illustrate why context matters; this article does not provide local passage instructions.
Distinguish reported traffic from complete awareness
The Automatic Identification System, or AIS, contributes useful reports about equipped vessels. It is not a complete inventory of everything afloat. Transmission gaps, reception limitations, incorrect manual entries and delayed messages can all affect the picture. Reported destination or navigational status should not be mistaken for a reliable statement of another vessel’s next manoeuvre.
A fused traffic display may combine AIS, radar tracks and other observations. Fusion introduces its own decisions: which reports belong to the same object, which track should persist and when a target should be discarded. A confident symbol can therefore conceal an uncertain association. The interface should make age and quality inspectable rather than merely smoothing away disagreements.
Make the vessel model specific
A generic fuel curve may be inappropriate for a particular loading condition, hull condition or machinery configuration. Draft, trim, displacement, speed through water, auxiliary loads and weather exposure can change the relationship between speed and consumption. Historical data can improve a model, but historical averages may fail when operating conditions change.
The useful inventory includes both known values and unresolved assumptions. Record where a value came from, when it was checked and which decisions depend on it. If an input is unavailable, identify how the system responds: does it stop, request confirmation, substitute a default or continue silently? These behaviours can matter more than the number of data feeds advertised.
Sources for further reading
- International Hydrographic Organization — hydrographic standards and product context.
- International Maritime Organization: AIS — the role and regulatory context of AIS.
- European Centre for Medium-Range Weather Forecasts — forecasting methods and uncertainty resources.